ARTICLE
We outgrew our forecasting tool so we built our own (Agenticly)
17 minutes read
the problem with generic tools
Every software consultancy eventually runs into the same wall: the tools designed for "businesses like yours" were not actually designed for your business.
For a while, we used an off-the-shelf tool (a popular financial solution) as our financial forecasting backbone. The tool is a solid, well-designed cashflow and P&L planning tool. For a lot of businesses — especially early-stage ones or those with simple, predictable revenue — it works well. You build a model in a spreadsheet-like canvas, wire up your revenue and cost drivers, and get projections.
But we're a software consultancy. Our financial reality is messier than that.
what made the off-the-shelf tool insufficient for us
Our P&L is driven by a matrix of interdependent variables that off-the-shelf tools struggle to model cleanly:
Engineer allocations across multiple projects. A single engineer can be split 50/50 across two client projects, each with a different billing rate, different contract currencies, and different start/end dates. Mid-month changes — an engineer rolling off one project and onto another on the 15th — need to be prorated correctly. The tool had no native concept of resource-level allocation tracking.
Romanian RON/USD foreign exchange (FX) exposure. We pay salaries in RON but bill clients in USD. Our margins are directly sensitive to the monthly exchange rate. We needed FX rates tracked per month, with automatic conversion baked into every cost and revenue calculation — not a manual override we'd remember to update.
Bench cost visibility. When engineers aren't allocated to a billable project, they're on bench. That cost is real and needs to be surfaced clearly — by engineer, by month, by project context. Generic tools either ignore the bench or require awkward workarounds.
Scenario modelling. "What does our P&L look like if we win this new contract?" or "What if we scale down as we’re ending another engagement. " These aren't hypothetical questions — they're weekly planning conversations. We needed speculative scenarios that could be toggled on/off without touching the base forecast.
Monthly closing actuals. At the end of month, forecasts need to be reconciled against actuals. The tool doesn't have a concept of "locking" a month with verified figures and carrying the delta forward.
Every one of these needs required either a manual workaround, a parallel spreadsheet, or was simply impossible in the off-the-shelf tool. We kept bolting things together — the tool for the top-level view, Google Sheets for allocation tracking, a separate spreadsheet for FX, another for scenarios. The model became fragile, inconsistent, and time-consuming to maintain.
The answer wasn't a better off-the-shelf tool. It was to build our own.
the build: specs-driven, agent-executed
This is where it gets interesting — because the way we built this tool is itself a demonstration of where software development is heading.
We didn't hire a team of developers and spend six months building a product roadmap. We wrote detailed specifications, and we used an AI agent (Claude) to build the entire product.
What "Specs-Driven" Actually Means
Specs-driven development is not about writing a Word document and throwing it over the wall. It's about being precise enough in your requirements that an AI agent can execute against them autonomously — asking clarifying questions when genuinely ambiguous, making reasonable decisions where the spec is silent, and producing production-quality code.
For this project, that meant:
- A CLAUDE.md file in the root of the repo defining the architecture, conventions, tech stack, and data model
- GitHub Issues for every feature, with enough context for the agent to understand not just what to build but why — the business logic behind each requirement
- A branching and PR workflow enforced by git hooks, so the agent would create feature branches, open PRs, and keep the GitHub project board in sync automatically
The agent had access to the full codebase context at all times. It understood the schema, the existing patterns, the known risks (like our dual SQLite/PostgreSQL constraint), and the test suite. Work felt less like managing a contractor and more like having a senior engineer on the team — one who reads the docs before writing a line of code.
The Stack
The result is a full-stack web application:
- Backend: Node.js / Express 5, Prisma ORM, SQLite locally / PostgreSQL in production
- Frontend: React 19, Vite, Tailwind CSS v4
- Hosting: Google Cloud Run (Europe West)
- Testing: Vitest with golden snapshot tests on the P&L engine
- Workflow: GitHub Actions-adjacent — git hooks for branch protection and pre-push test enforcement
The core of the system is plEngine.js — an ~830-line P&L calculation engine that handles allocation proration, FX conversion, bench cost distribution, overallocation scenarios, and multi-month projections. It's the most critical file in the codebase and the one we invested the most specification effort into.
what we built: a tour
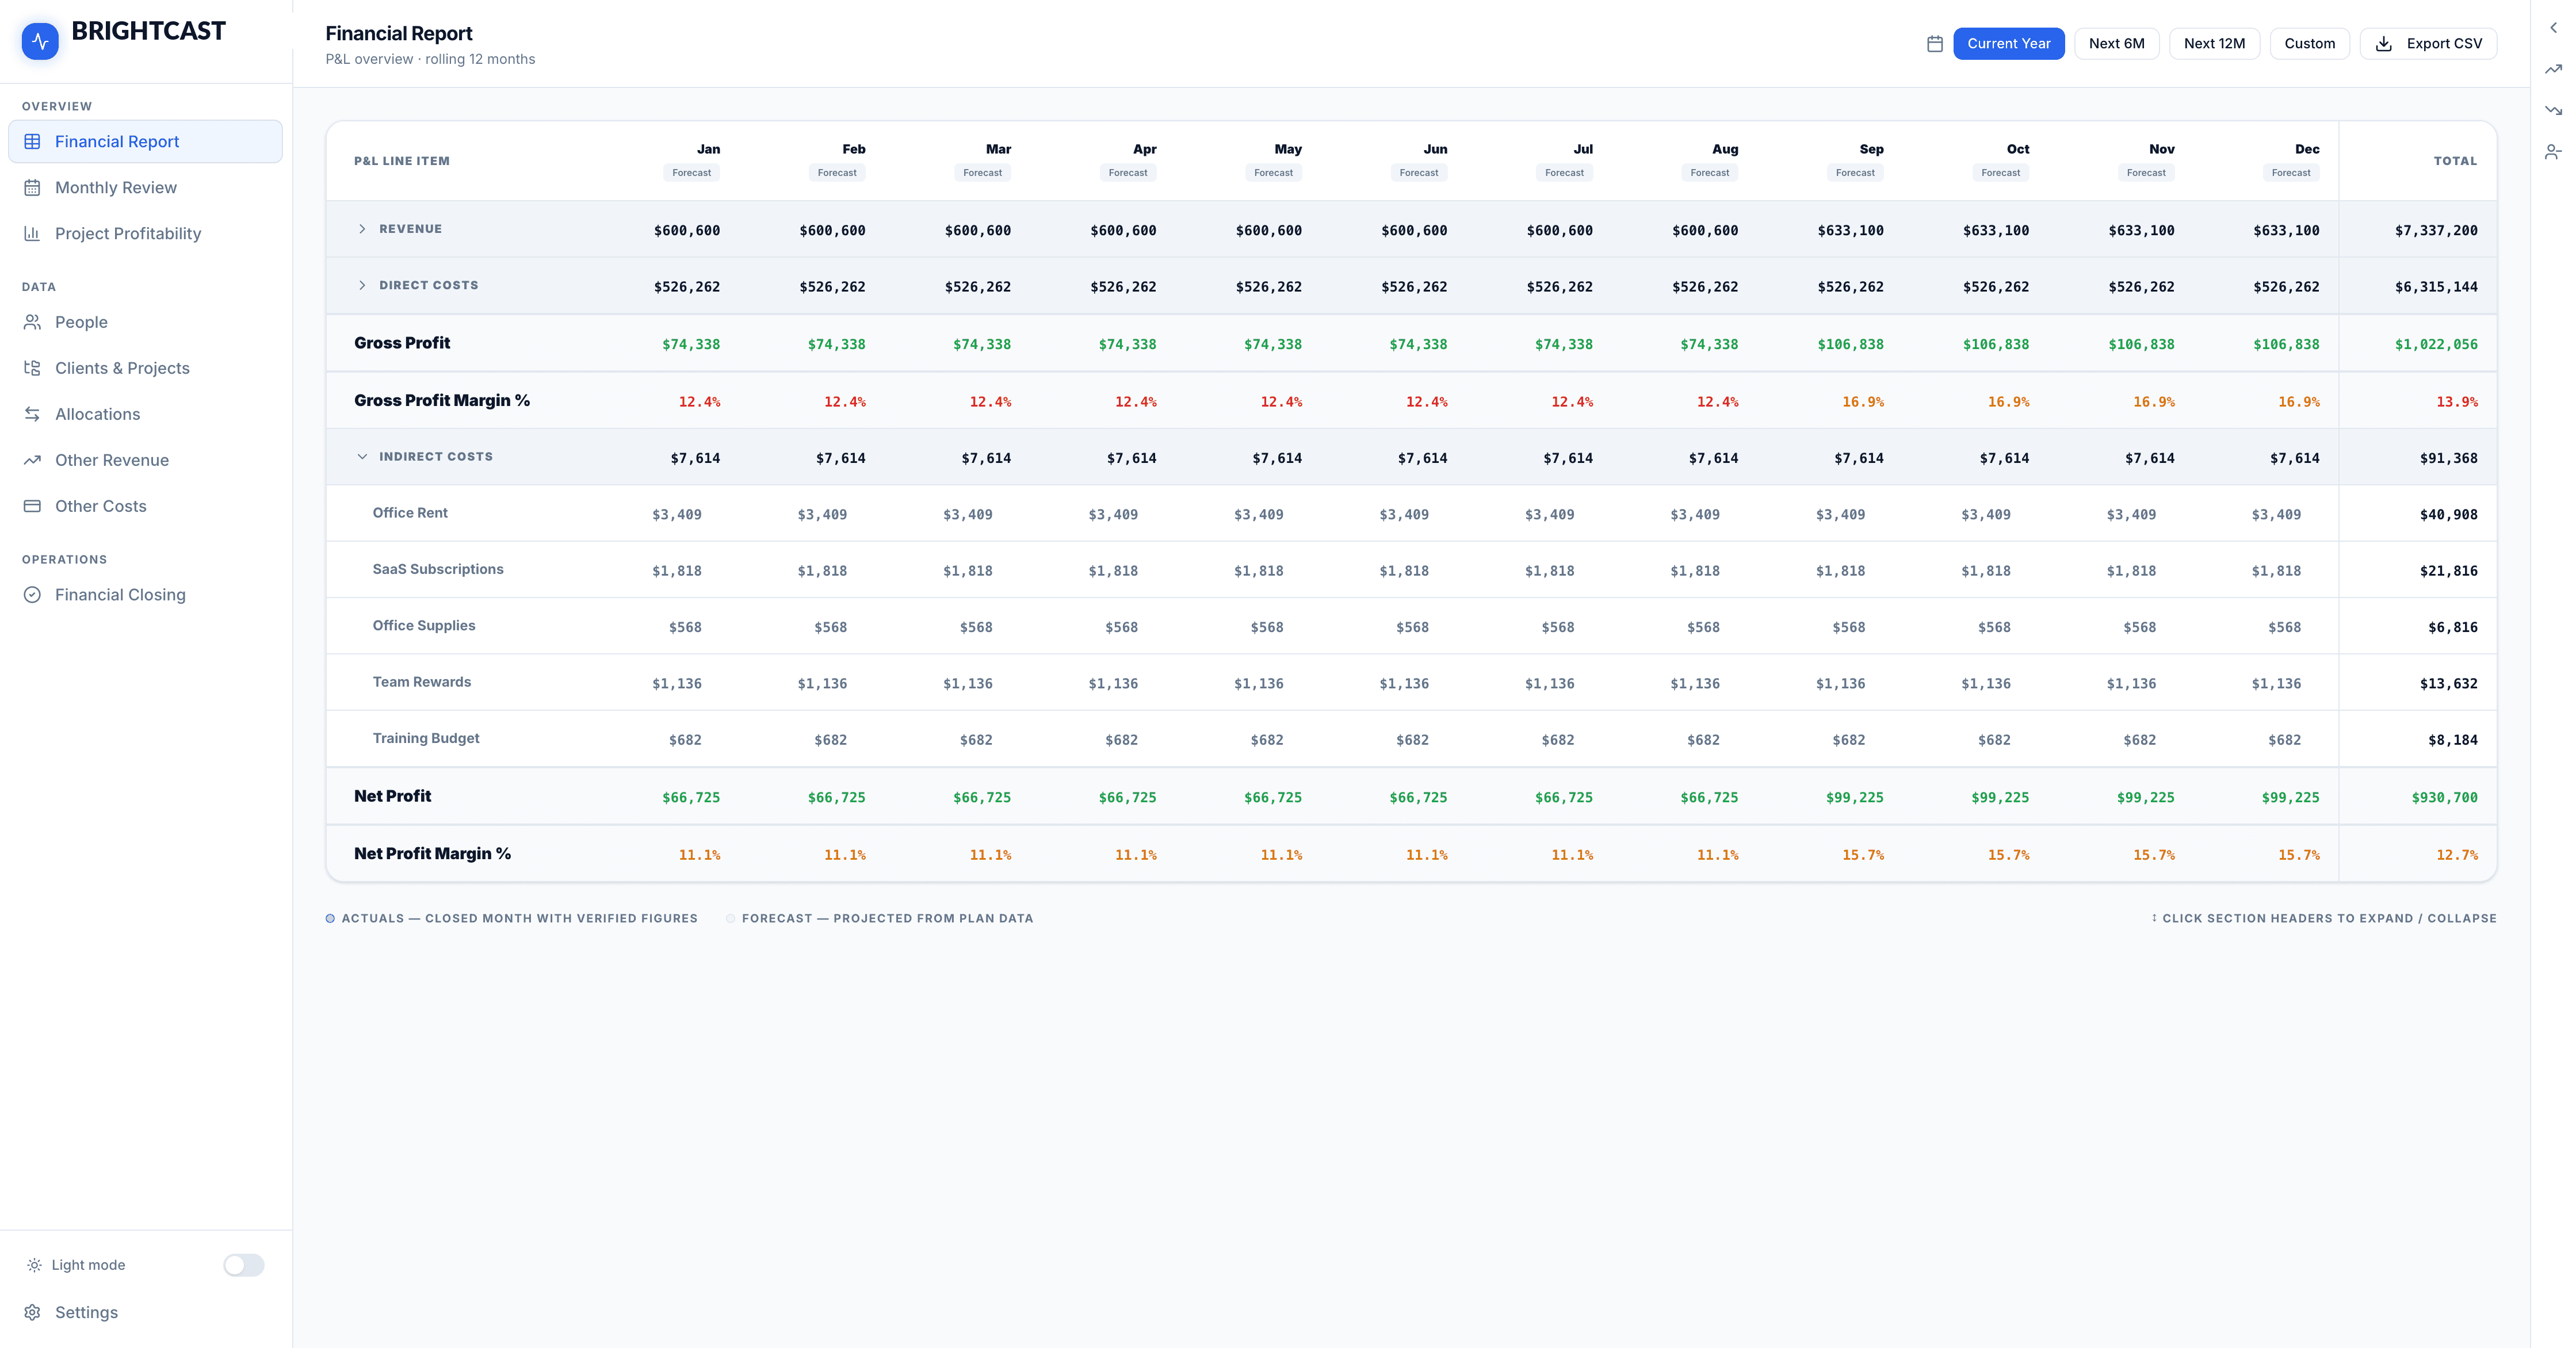
Financial Report — The P&L Dashboard
The top-level view is a rolling 12-month P&L table. Revenue, Direct Costs, Gross Profit, Indirect Costs, and Net Profit — broken down by month, with forecast vs. actuals clearly distinguished. Months that have been closed with verified figures are marked as Actuals; future months show Forecast projections from the current plan data.
The right-hand panel is the scenario sidebar — where you can layer in speculative revenue projects, model engineer layoffs, or add planned hires, and immediately see the impact on the P&L. Every scenario toggle instantly recalculates the full 12-month projection.
All visuals and screenshots in this article are for illustrative purposes only and use simulated data. No real internal financial data is disclosed.
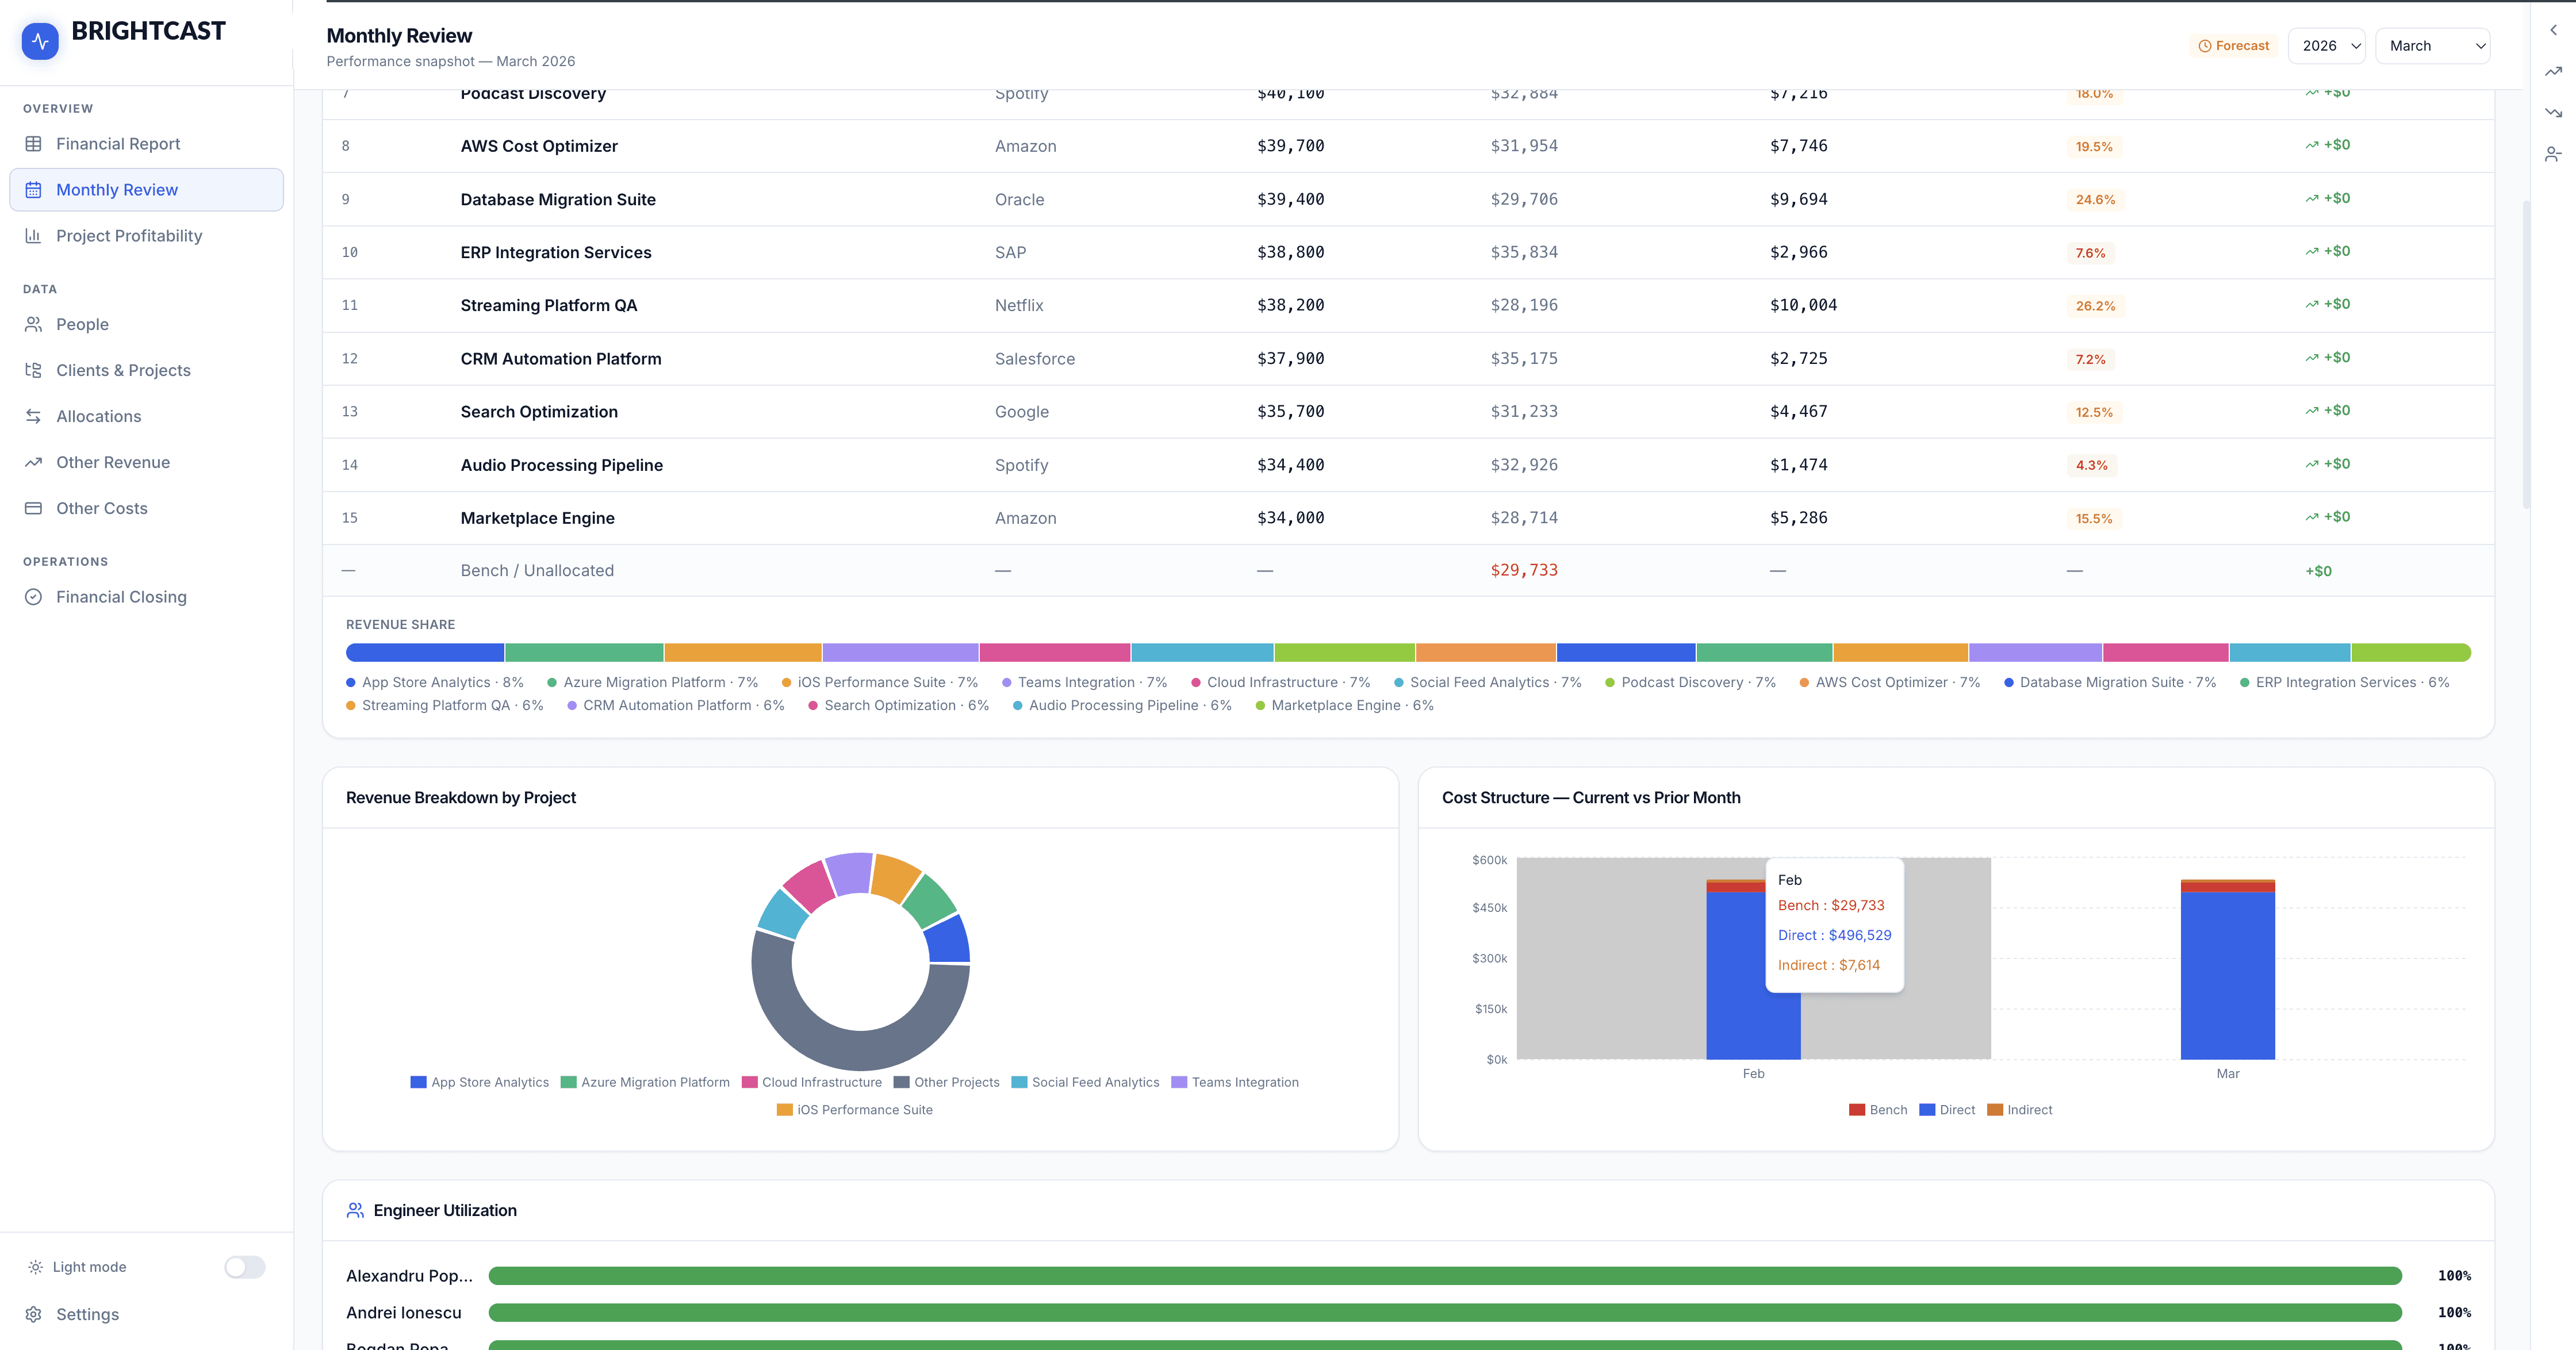
Monthly Review — The Management Dashboard
The Monthly Review view is designed for the weekly management conversation. It surfaces a snapshot of the current month: Total Revenue, Direct Costs, Net Profit, Net Margin, Bench headcount and cost, and the current FX rate — all with deltas vs. the prior month.
Below the scorecards, "What Drove This Month" provides a plain-English explanation of the key changes: new projects added, engineers who rolled on or off, notable cost movements. This is not a manual entry — it's computed automatically from the data.
The Projects This Month table shows per-project revenue, direct cost, gross profit, and margin — with a revenue share bar chart for quick visual weight. This is the view we open in every management sync.
All visuals and screenshots in this article are for illustrative purposes only and use simulated data. No real internal financial data is disclosed.
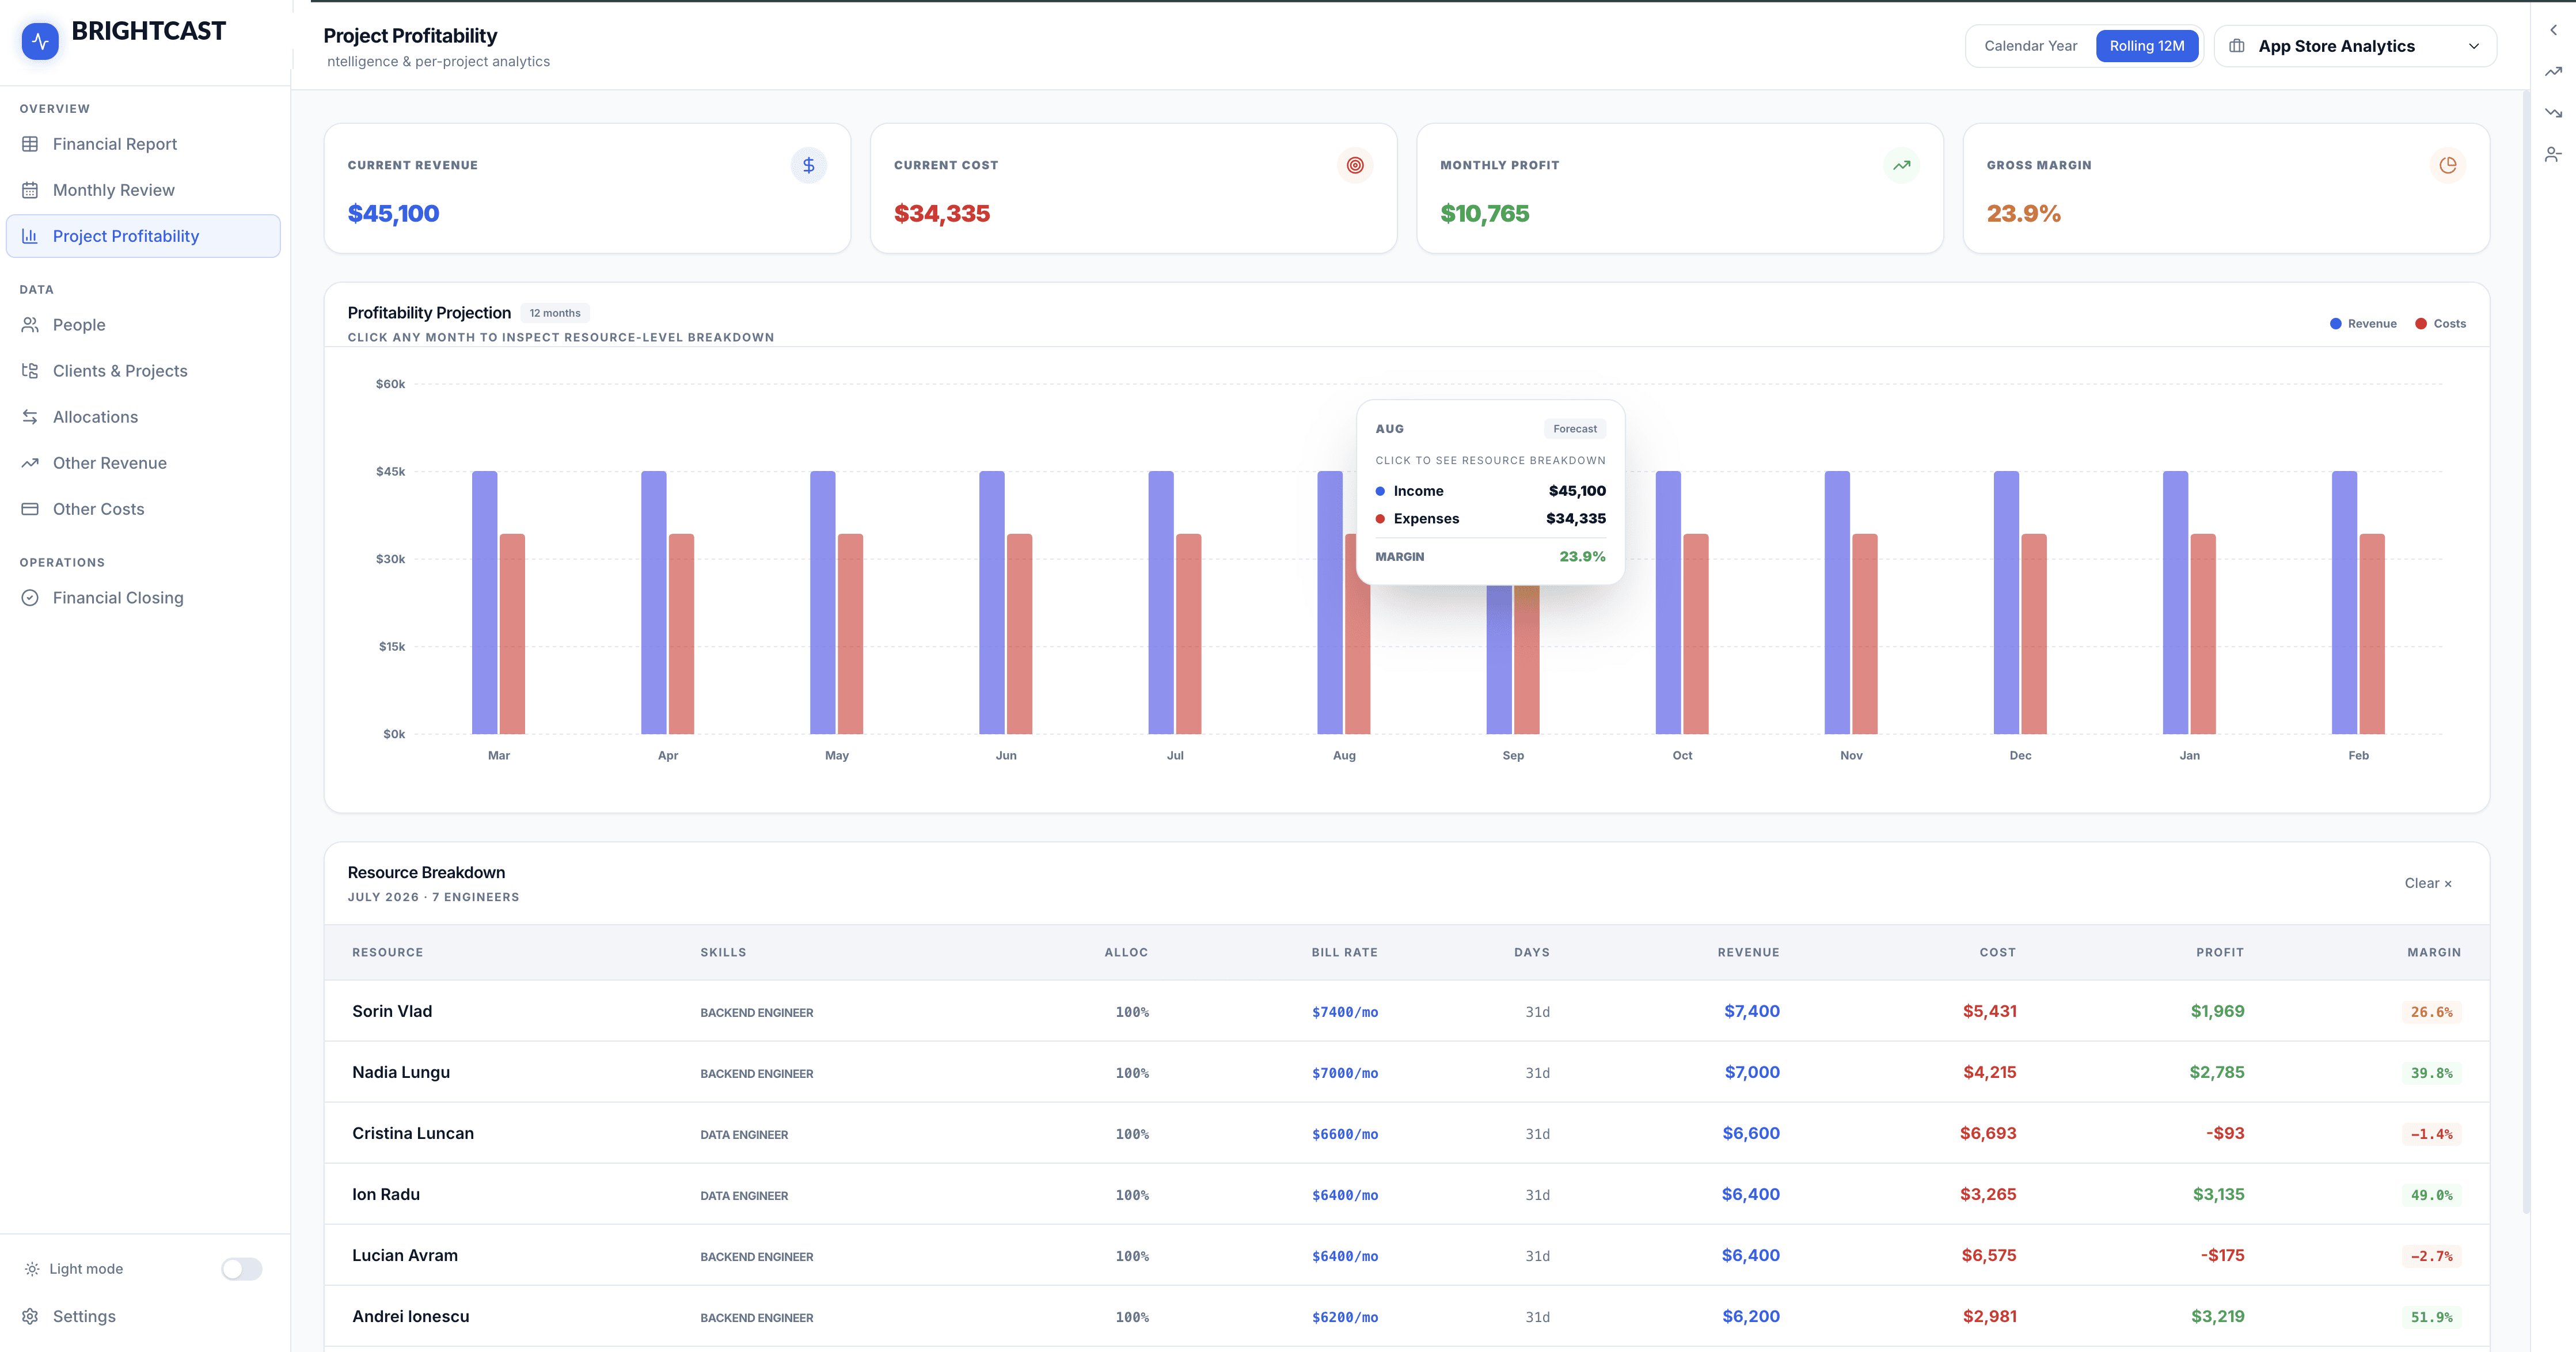
Project Profitability — Per-Project Deep Dive
Select any project to see its 12-month profitability projection, including a bar chart of Revenue vs. Costs per month. Click any month bar to drill into the resource-level breakdown — which engineers were allocated, at what rates, and what they contributed to revenue and cost.
The "Monthly Drivers" section surfaces a plain-English explanation of what changed versus the prior month for each month. "Engineer 1 rolled off — $11,600 revenue / $7,471 cost." No digging through rows of data; the system tells you what moved the needle.
All visuals and screenshots in this article are for illustrative purposes only and use simulated data. No real internal financial data is disclosed.
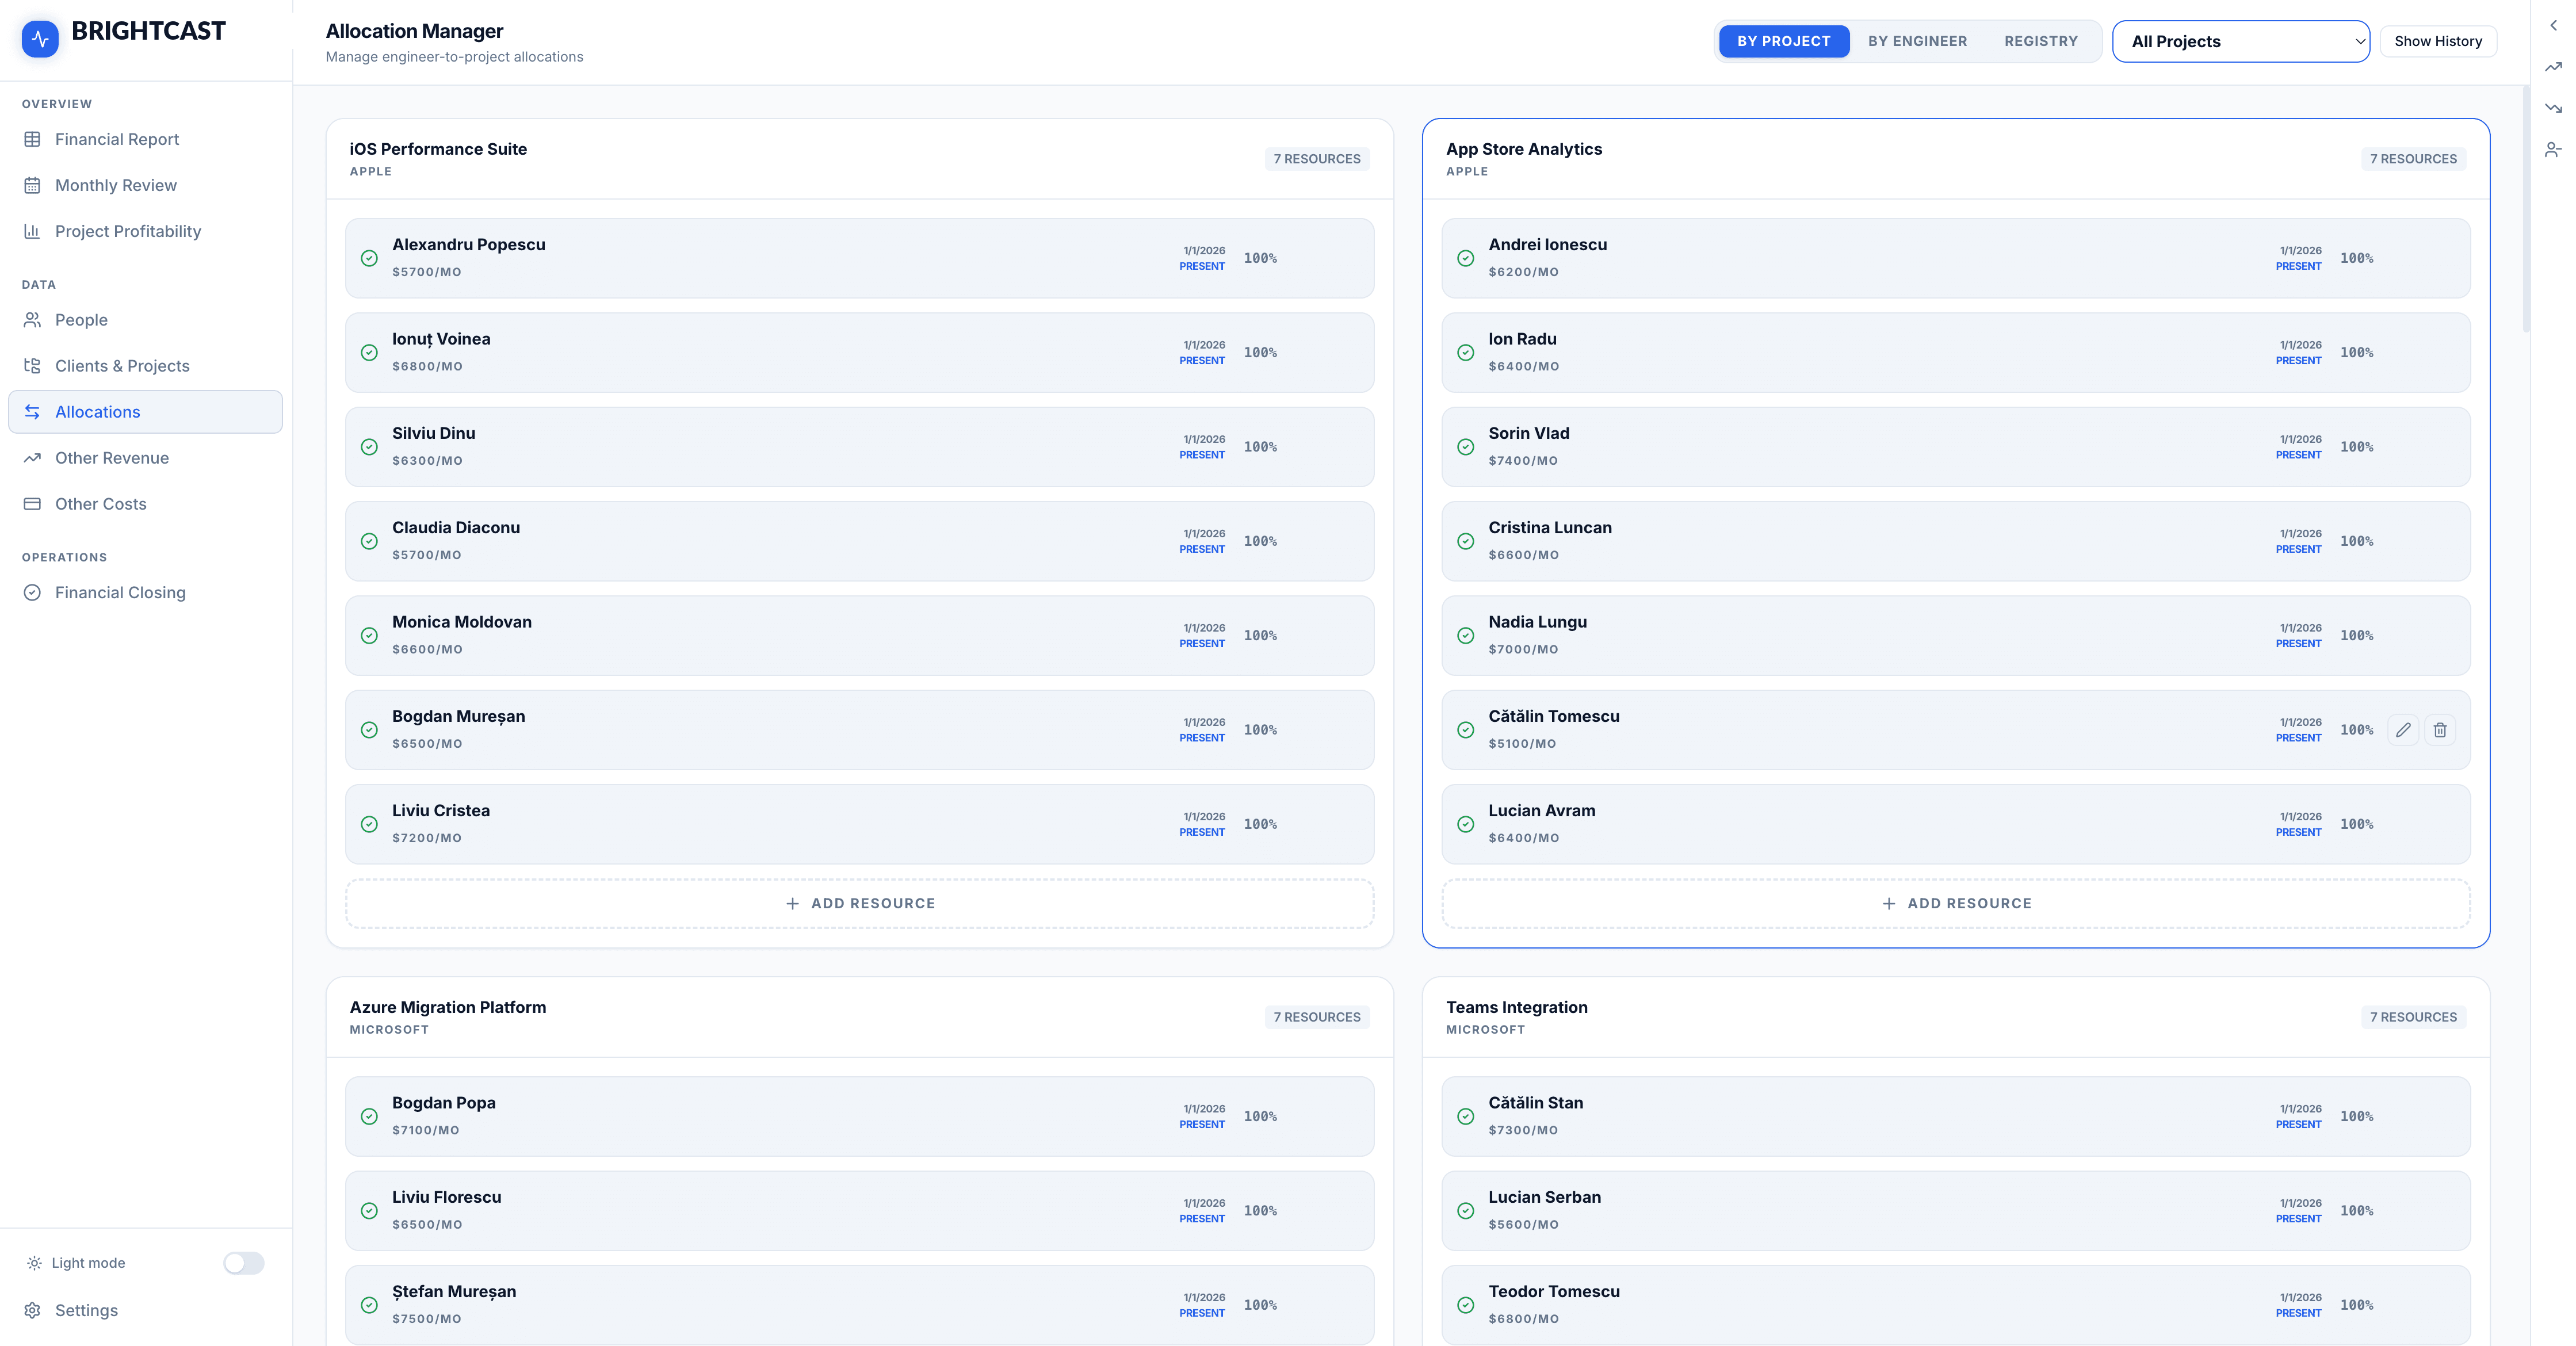
Allocation Manager — Resource Planning
The Allocation Manager is where the plan is built. Engineers are assigned to projects with a billing rate, billing rate type (monthly or hourly), allocation percentage, and date range. A single engineer can appear across multiple projects simultaneously; the engine handles the proration automatically.
The view supports filtering by project or by engineer, and a Registry mode shows all active allocations in a flat list. Forecast allocations — representing planned hires or anticipated resources — are visually distinguished with an orange badge so it's always clear what's real versus speculative.
All visuals and screenshots in this article are for illustrative purposes only and use simulated data. No real internal financial data is disclosed.
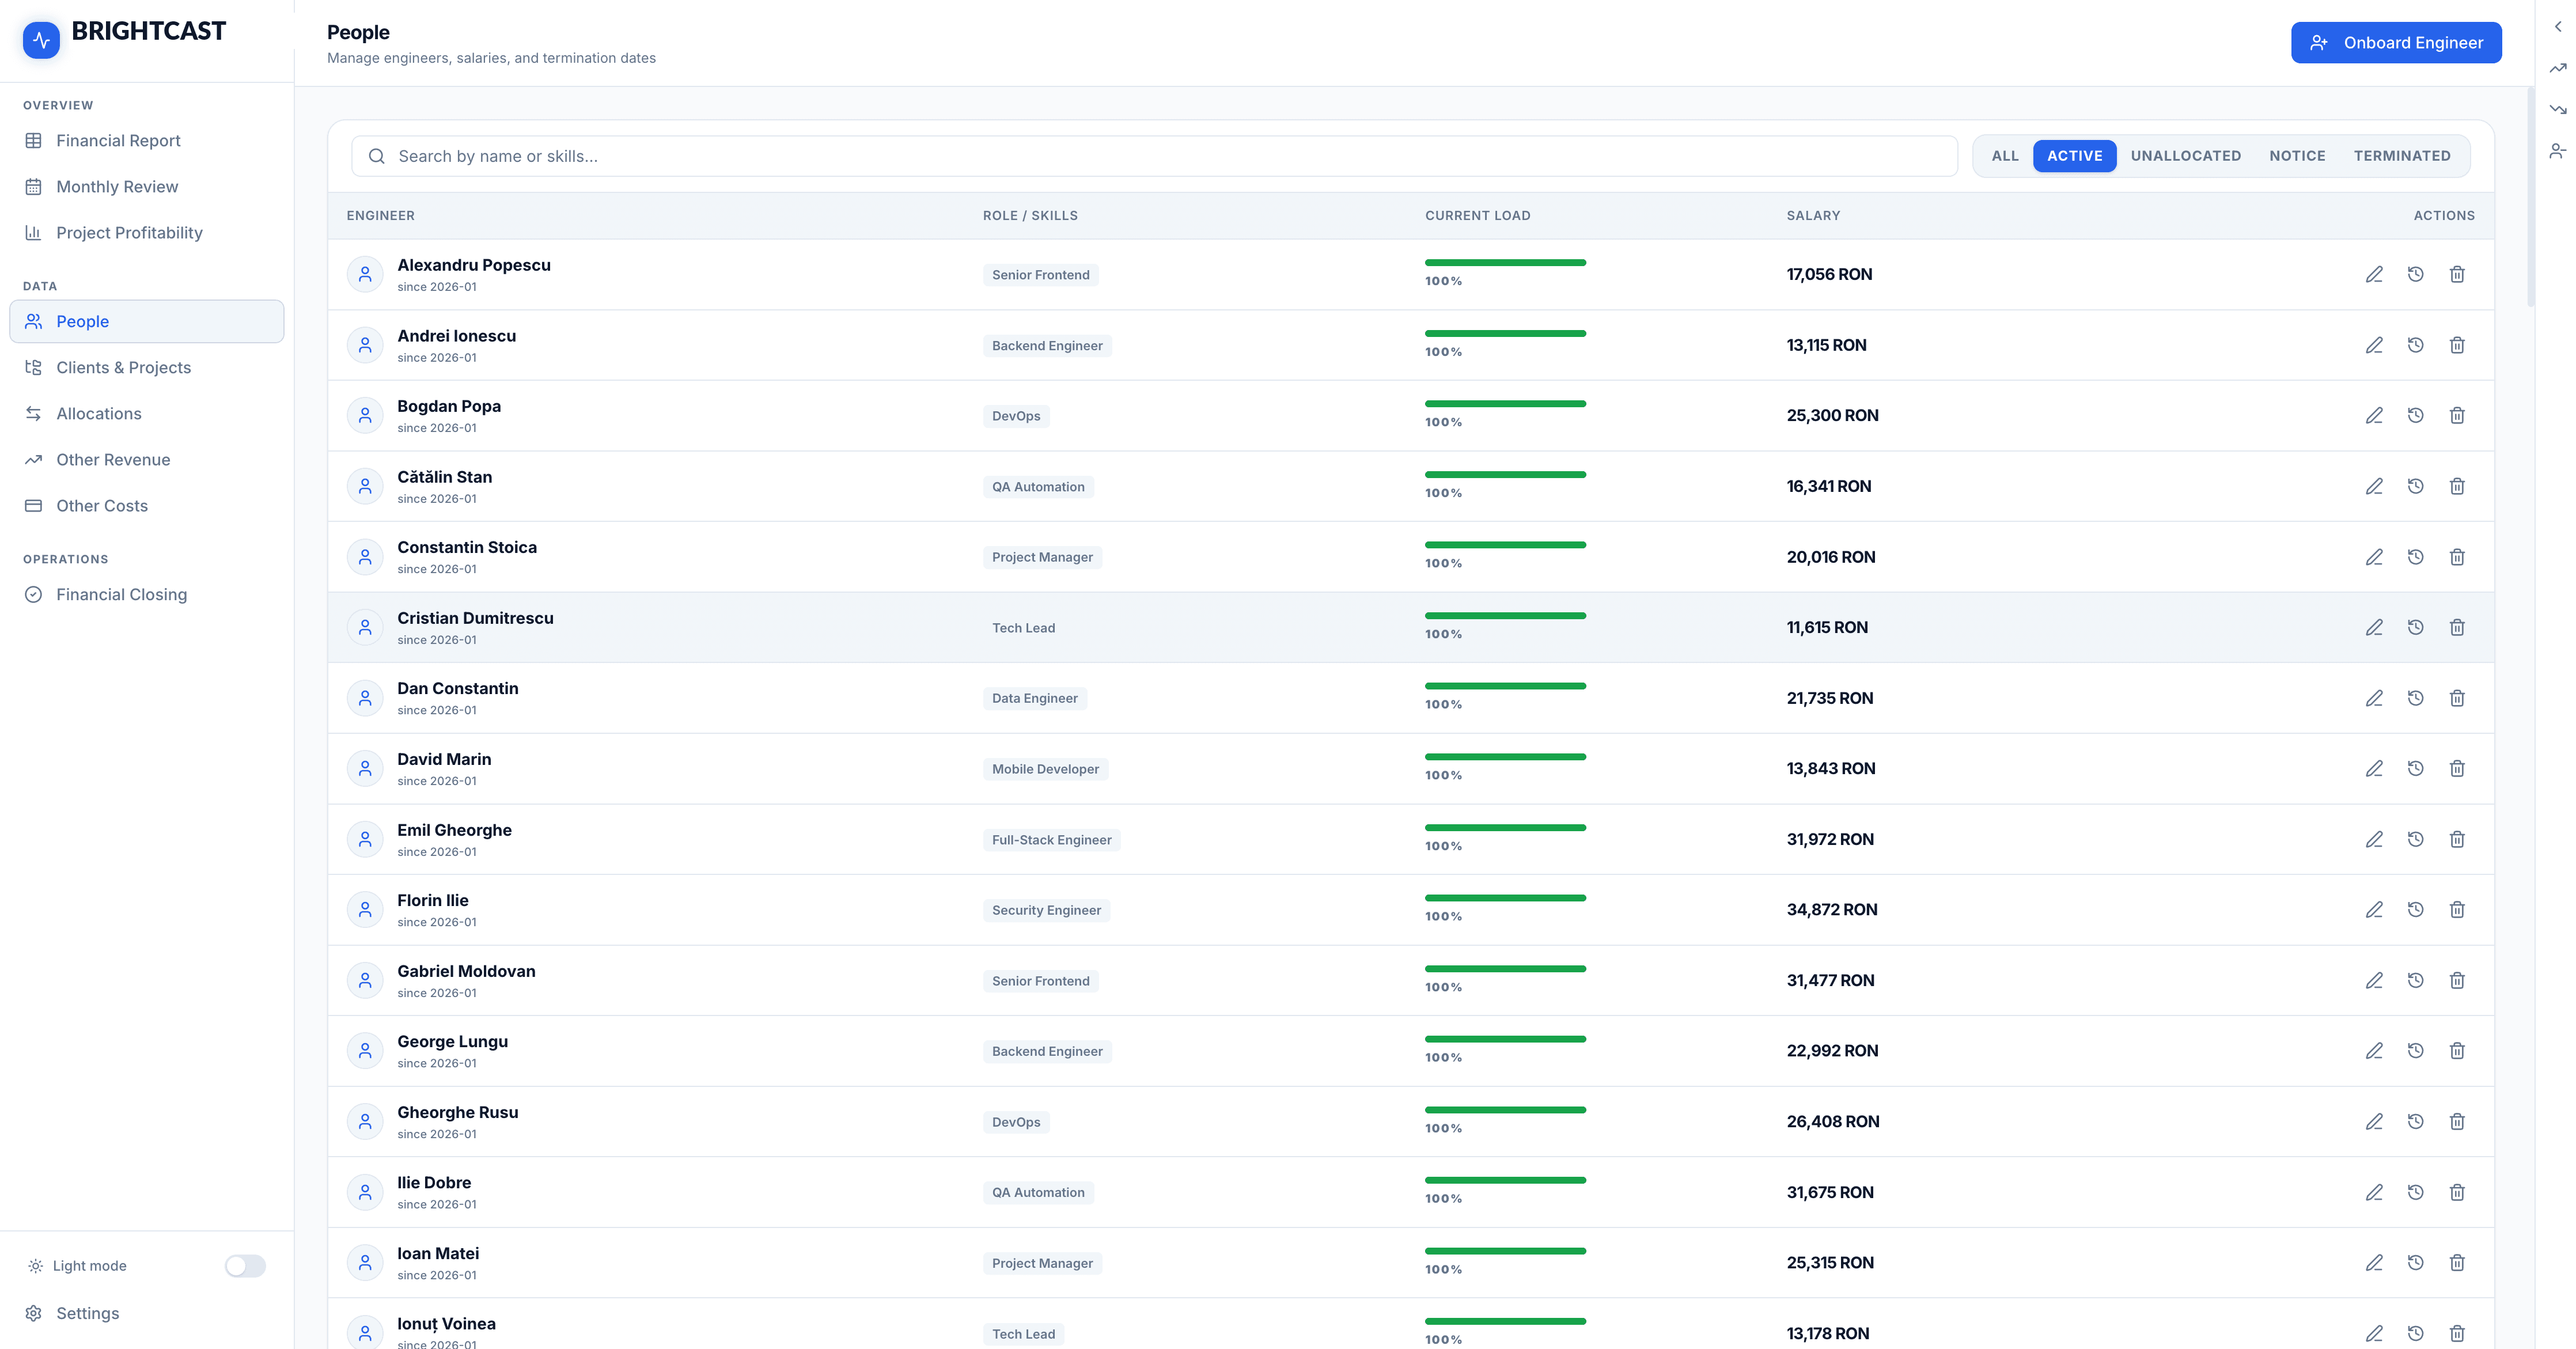
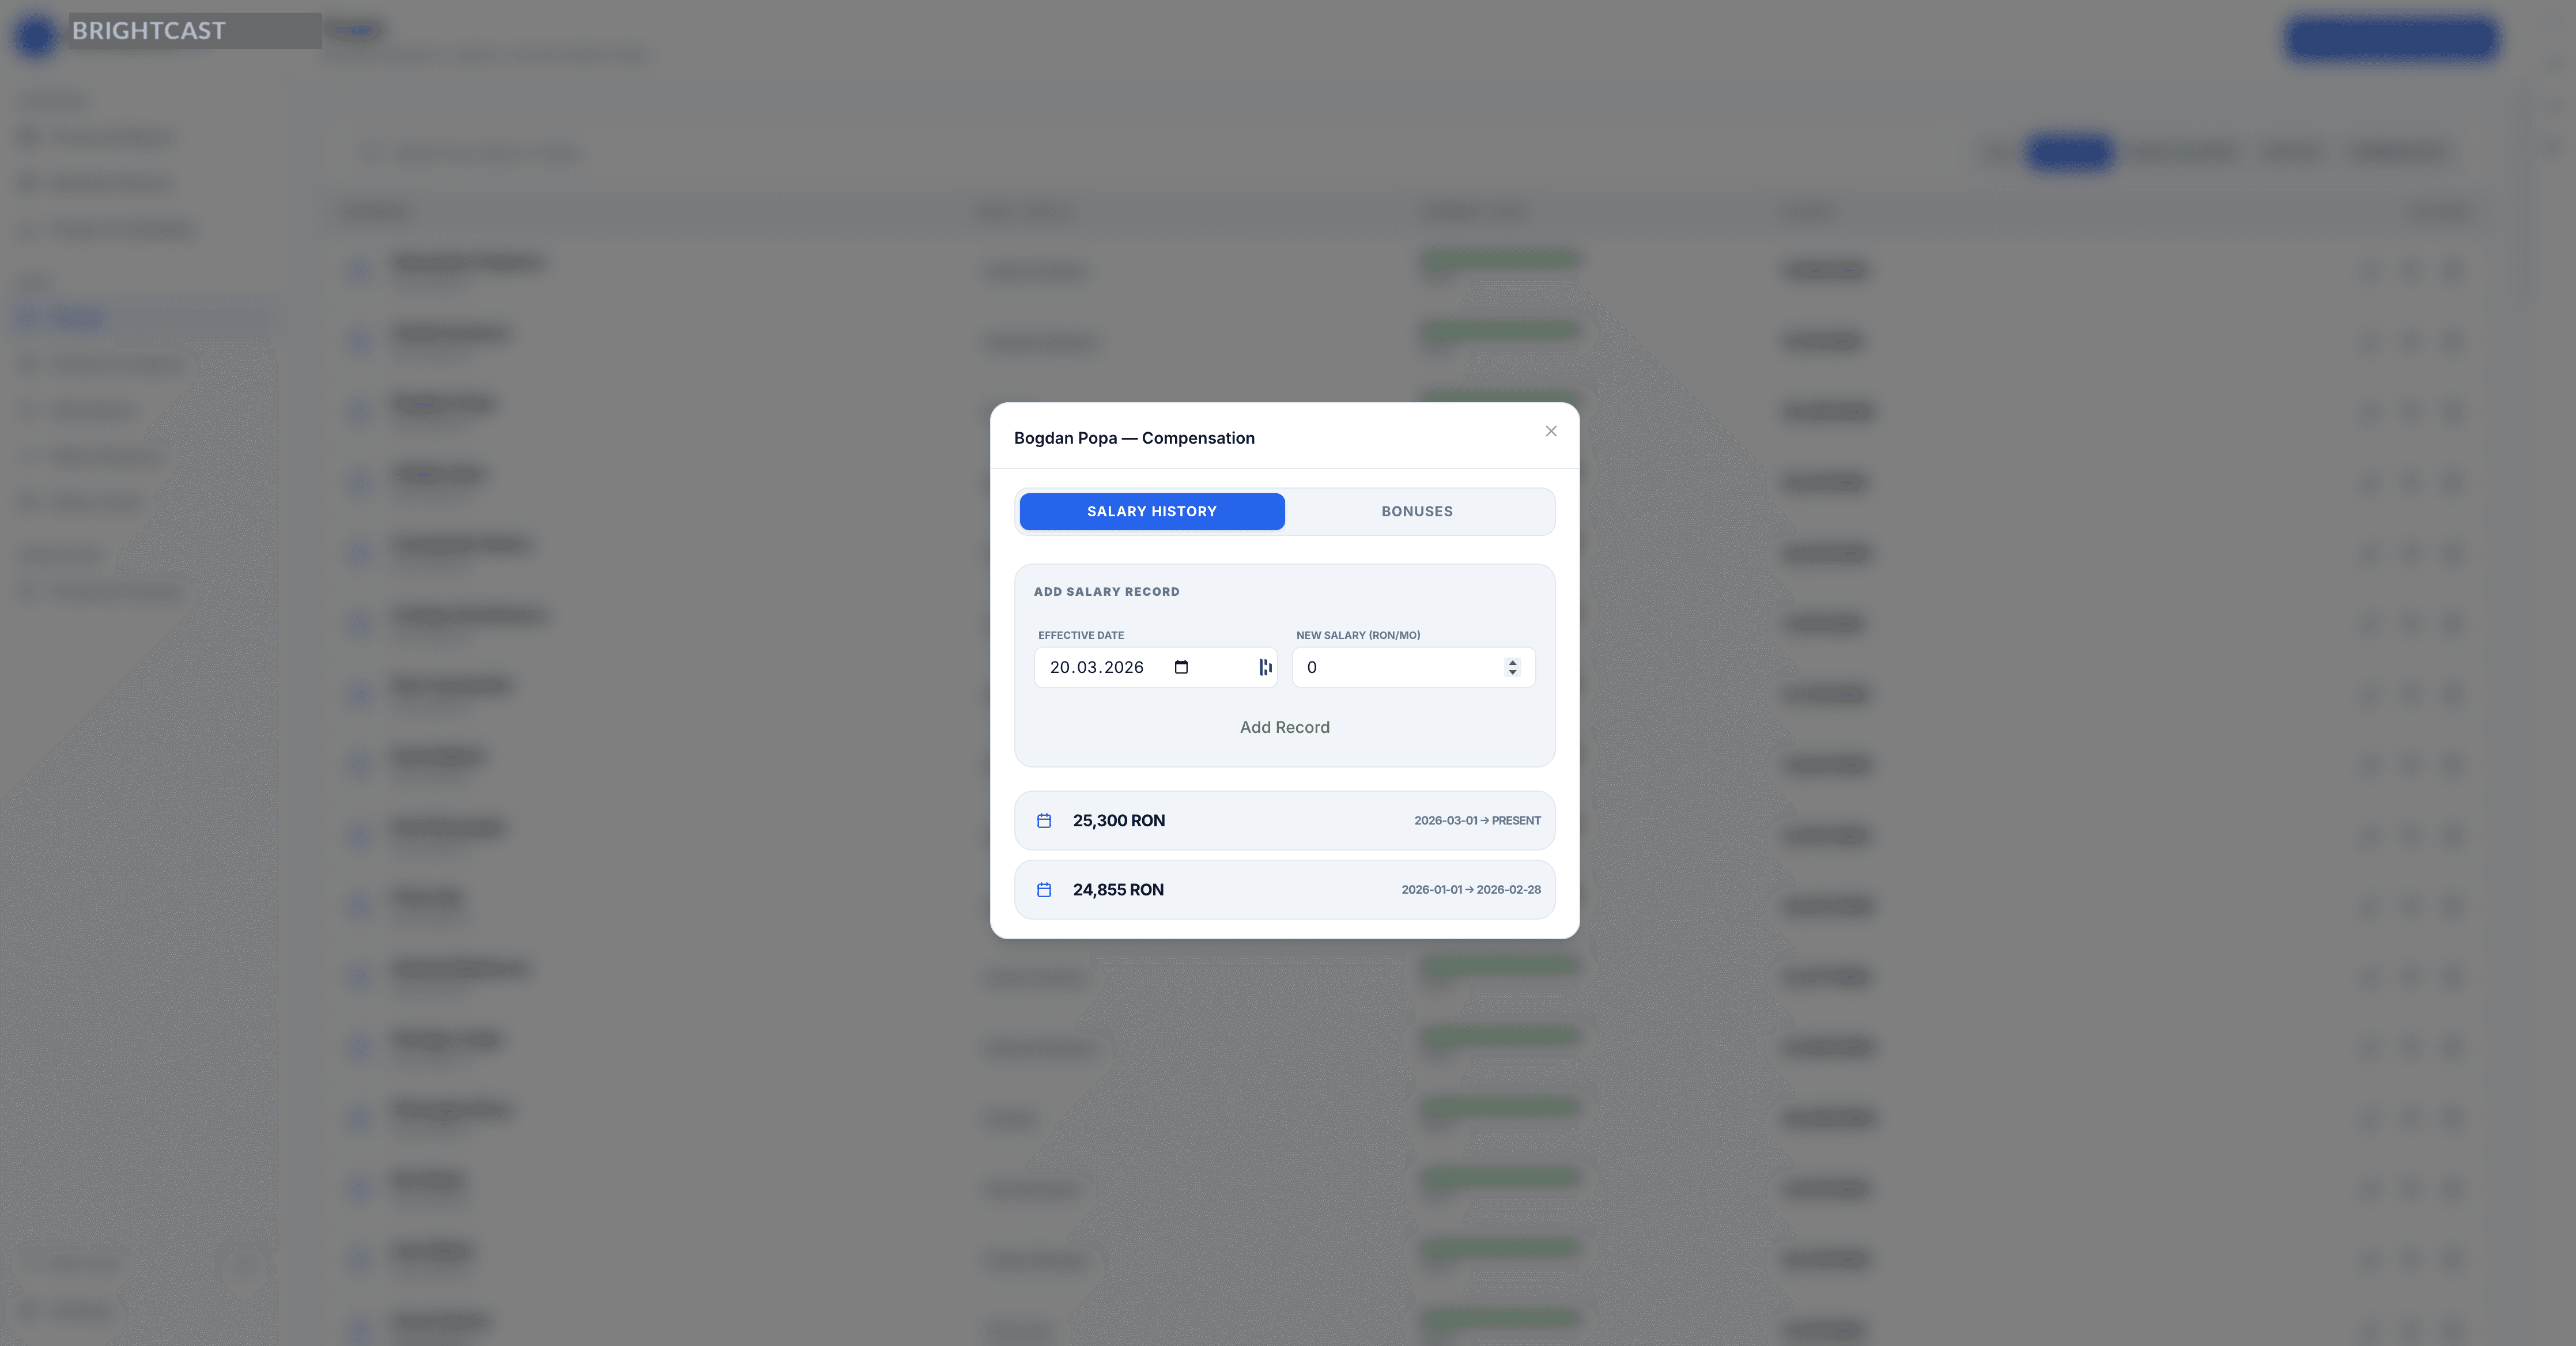
People — Engineer Roster & Salary History
The People view manages the full engineer roster: roles, salary history (with effective dates, so past periods calculate correctly), current allocation load, and termination dates. A colour-coded load bar instantly flags overallocated engineers in red.
Salary records are tracked with full history, so changing someone's salary mid-year doesn't break historical P&L calculations. The overallocation bonus system handles cases where engineers work beyond 100% — distributing the additional cost proportionally across the projects that consumed the extra capacity.
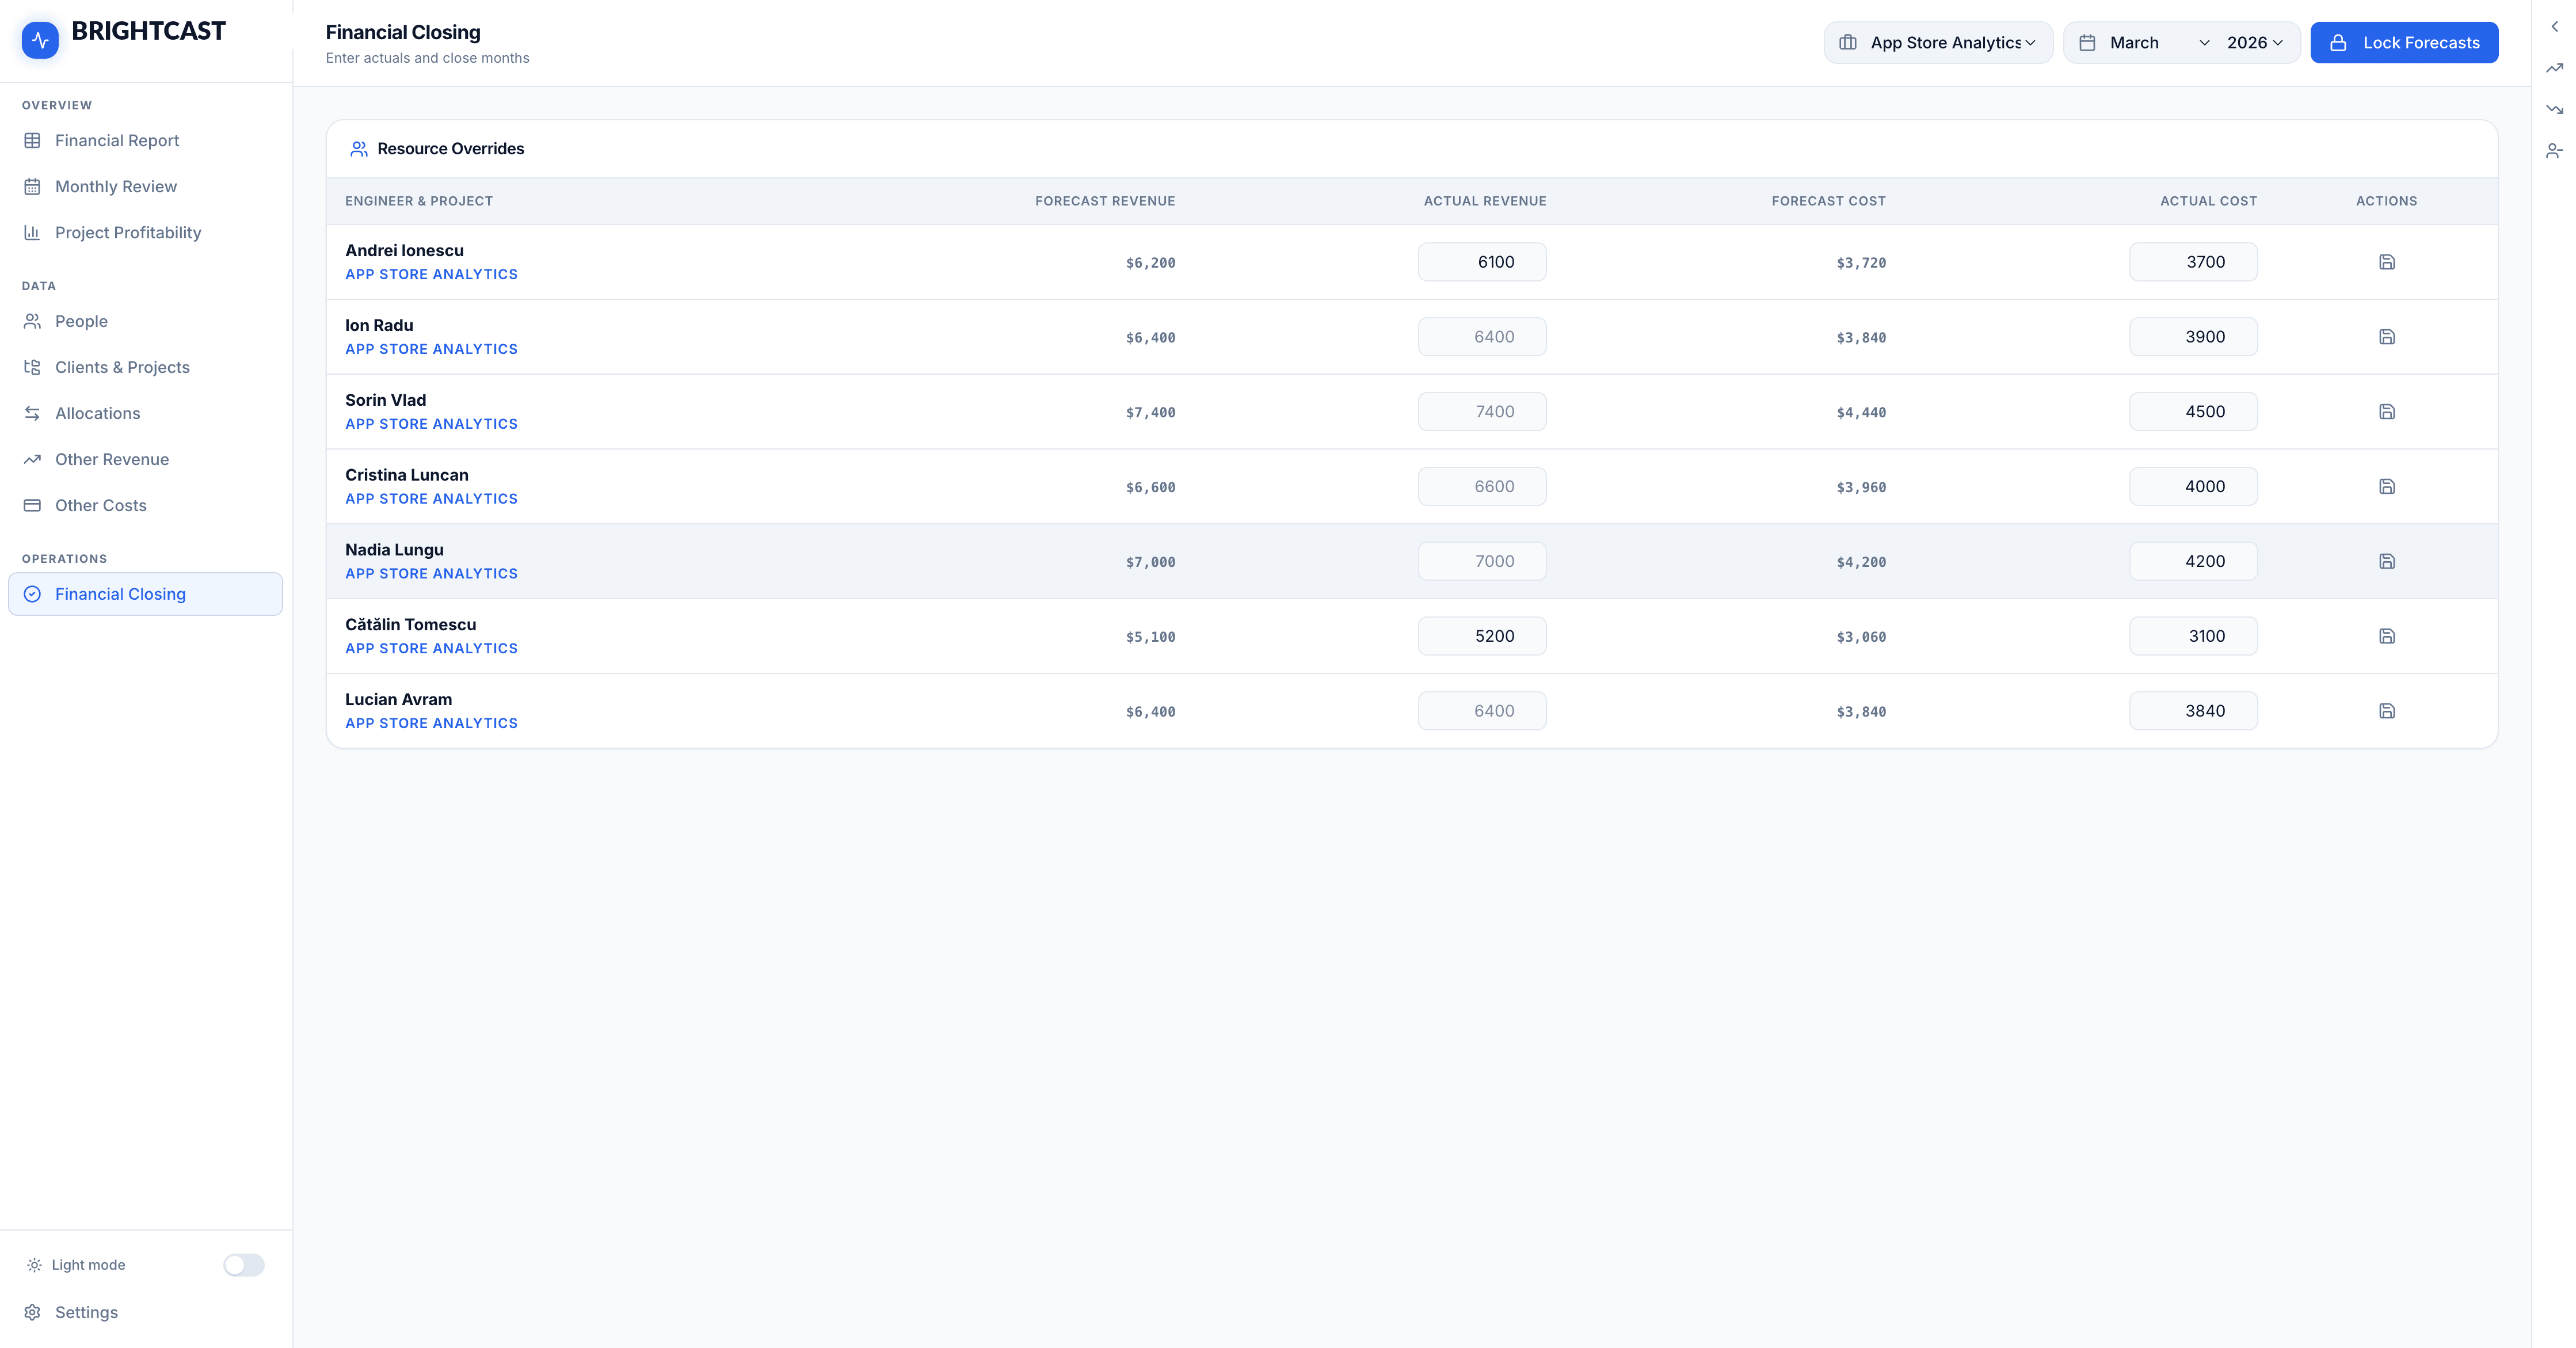
Financial Closing — Month-End Actuals
At the end of each month, the Financial Closing view lets us enter actual revenue and cost figures per engineer per project — overriding the plan-based forecast with verified numbers. Once all actuals are entered, the month is locked. Locked months appear as Actuals in the Financial Report with a distinct visual treatment, and the forecast engine carries forward from the last locked month.
This close cycle is what makes the tool genuinely useful for financial management rather than just planning: the model is always grounded in reality, not drifting away from it.
All visuals and screenshots in this article are for illustrative purposes only and use simulated data. No real internal financial data is disclosed.
the results
Comparing our workflow before and after:
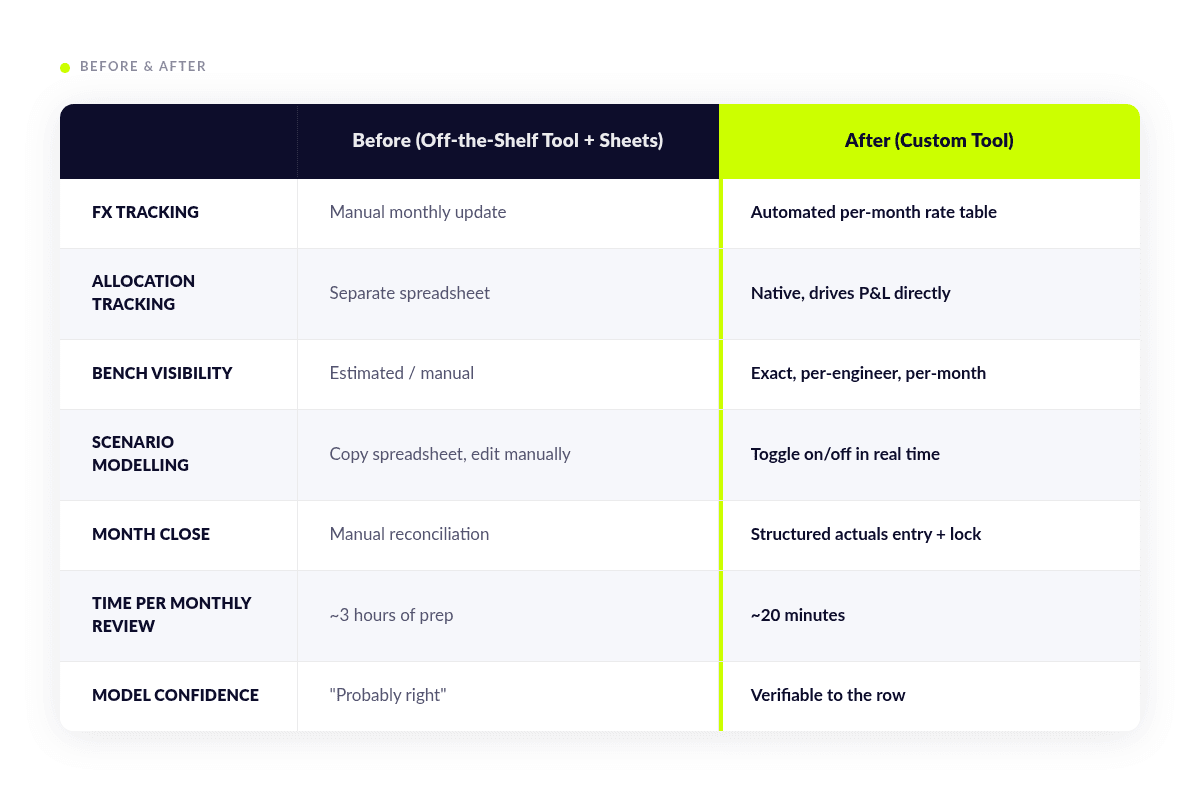
That last row matters most. We used to spend time in management meetings debating whether the numbers were right. Now we debate what to do about them.
what this says about how software gets built
We built the first usable version of this tool in a few weeks in the evenings — not because the problem was simple, but because the build process was fundamentally different from what software development looked like five years ago.
The key insight is that an AI agent is not a code generator. It's a collaborator with near-unlimited patience for context, perfect recall of everything in the codebase, and the ability to execute complex, multi-file changes that follow established patterns consistently. What it needs from you is not prompts — it's specifications.
The bottleneck is no longer writing code. It's thinking clearly about what you actually need.
At HEITS.digital, we've been pushing this model of work hard — both for our internal tooling and as a capability we're developing for clients. The specs-driven, agentic approach isn't a shortcut; it's a higher discipline. It requires you to understand your domain deeply enough to articulate it precisely. The reward is that once you've done that work, execution is fast, consistent, and auditable.
We believe this is the direction professional software development is heading. Not replacement of engineering expertise — but a radical amplification of what a small, precise team can build and maintain.
what's next
The tool is already in production for our internal planning. The backlog includes:
- Date ranges on expenses — currently expenses have no start/end date, limiting scenario modelling for time-bound costs
- AI-generated commentary — generating the monthly narrative automatically from the data deltas
- Multi-currency billing — supporting EUR-denominated contracts alongside USD
- Client-facing reporting — exportable project health reports for client conversations
We're building in public, shipping fast, and learning what a properly spec-driven process can produce at pace.
If you're a consultancy, agency, or any people-heavy services business frustrated with generic financial tools — we'd be glad to talk.
FAQs
What is an agentic approach to software development?
An agentic approach means using an AI agent to execute development tasks based on detailed specifications. Instead of manually writing all the code, developers define architecture, logic, and constraints, and the agent builds within that framework while maintaining consistency across the codebase.
What is specs-driven development?
Specs-driven development is a process where the system is defined in precise, structured specifications before implementation. These specs include business logic, data models, and constraints, enabling an AI agent or developer to build features with minimal ambiguity.
Why did HEITS.digital build a custom P&L tool?
Off-the-shelf financial tools couldn’t model the complexity of a software consultancy. Key limitations included lack of resource-level allocation tracking, poor FX handling, no native bench cost visibility, limited scenario modelling, and no structured month-end closing.
What problems do generic financial forecasting tools have for consultancies?
Generic tools are built for predictable revenue models. They struggle with:
- multi-project engineer allocation
- mid-month allocation changes
- multi-currency billing and FX exposure
- bench cost tracking
- real-time scenario modelling
What is a P&L engine in this context?
A P&L engine is the core logic that calculates revenue, costs, and profit over time. In this system, it handles allocation proration, FX conversion, bench costs, and multi-month projections across all projects and engineers.
How does the custom tool handle engineer allocation?
Engineers can be allocated across multiple projects with different rates, percentages, and time ranges. The system automatically prorates revenue and costs, including mid-month changes and overallocation scenarios.
How is foreign exchange (FX) handled in the system?
FX rates are tracked per month and automatically applied to all revenue and cost calculations. This removes manual adjustments and ensures margins reflect real exchange rate fluctuations.
What is bench cost and why does it matter?
Bench cost represents the cost of engineers who are not allocated to billable work. It directly impacts profitability and needs to be tracked accurately per engineer and per month.
How does scenario modelling work in the tool?
Users can toggle scenarios such as new projects, hires, or layoffs. Each scenario updates the full 12-month P&L in real time without affecting the base forecast.
What is financial closing in this system?
At the end of each month, actual revenue and costs are entered and the month is locked. This ensures forecasts are continuously grounded in real financial data.
What tech stack was used to build the tool?
The system is built with:
- Backend: Node.js, Express 5, Prisma
- Frontend: React 19, Vite, Tailwind CSS
- Database: SQLite (local), PostgreSQL (production)
- Hosting: Google Cloud Run
How long did it take to build the tool?
The first usable version was built in a few weeks using a specs-driven, agent-assisted approach, significantly faster than traditional development timelines.
What role did AI play in building the product?
An AI agent (Claude) implemented the system based on detailed specifications. It handled feature development, code structure, and workflow integration, acting similarly to a senior engineer within defined constraints.
Is this approach replacing developers?
No. It changes their role. Developers focus more on defining systems, architecture, and logic, while AI handles execution. The bottleneck shifts from coding to clarity of thinking.
Who should consider building a custom financial tool like this?
Consultancies, agencies, and service-based businesses with complex resource allocation, multi-currency revenue, and dynamic planning needs will benefit most from a custom system.